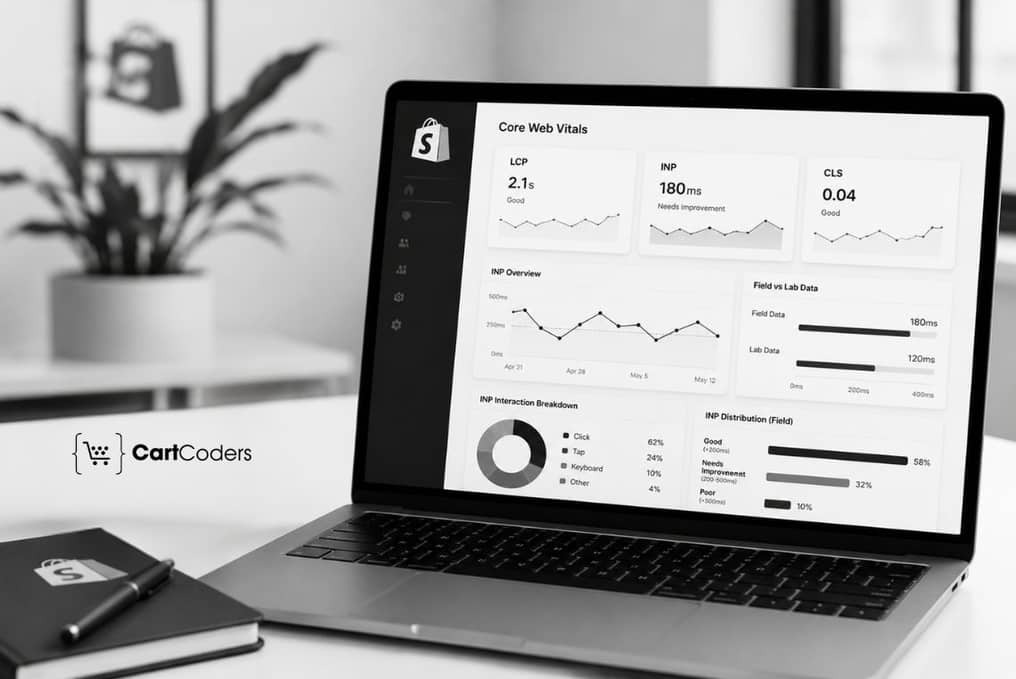

Interaction to Next Paint now shapes how shoppers feel every tap, click, and swipe on your Shopify store. For Shopify developers, ecommerce operations teams, technical SEO teams, and Shopify Plus teams, slow responsiveness quietly costs conversions long before anyone files a bug.
This guide gives your team a repeatable Shopify Core Web Vitals audit that starts with INP, then connects each finding to loading and layout stability. A structured Shopify technical audit reviews apps, theme JavaScript, and third-party scripts together, because these layers often block the main thread at the same moment.
INP deserves priority in 2026 because Shopify stores run on interaction-heavy templates, and apps inject scripts across pages you rarely inspect by hand. Cart drawers, variant pickers, collection filters, and product forms all add event handlers that delay the next paint. Since slow interactions push shoppers away, a Shopify CRO audit often pairs well with this work to protect conversions. When you audit INP first, you find the interactions real users struggle with, then you fix loading and stability with clear technical priorities and measurable checks.
Quick answer: A Shopify Core Web Vitals audit in 2026 should check INP first, because slow interactions usually come from app scripts, theme JavaScript, cart drawers, filters, product forms, and third-party tags that block the main thread. Field data shows which pages feel slow, and lab tools show why. You start with real user metrics, group problems by template, then score fixes by user impact and effort.
What Does a Shopify Core Web Vitals Audit Include?

A Shopify Core Web Vitals audit reviews how real shoppers experience loading, interactivity, and visual stability. The work pairs field data from real users with lab tests that recreate and diagnose those slow interactions. Your goal is a clear map of which templates fail INP, LCP, or CLS, and why.
Interaction to Next Paint replaced First Input Delay as a Core Web Vitals metric on March 12, 2024, so responsiveness now covers every interaction in a visit. A good INP score sits at 200 milliseconds or less at the 75th percentile of real users. Google measures loading with LCP at 2.5 seconds or less, and visual stability with CLS at 0.1 or less. web.dev’s Interaction to Next Paint documentation explains how the browser adds input delay, processing time, and presentation delay into one score.
Shopify Web Performance reports use these same Core Web Vitals and real user data from your storefront. The reports rank each metric as Good, Moderate, or Poor, and they mark app installs and theme updates on the timeline. This makes it easy to link a drop in INP to a recent change in your store.
Some third-party trackers claim that a large share of sites fail the 200 millisecond INP threshold. Independent field data in the 2025 Web Almanac tells a more careful story, since INP passes on roughly three in four mobile pages while loading stays the harder metric. INP still earns first priority because its failures cluster on interactive pages such as filters, forms, and carts, which is exactly what Shopify stores are built around.
INP still earns priority because its failures cluster on interactive pages such as filters, forms, and carts, which is exactly what Shopify stores are built around.
Core Web Vitals Thresholds at a Glance
The three metrics measure different feelings: does the page load, does it respond, and does it stay still? The table sets the target for each and where a Shopify audit should look first.
| Metric | What It Measures | Good Threshold | Shopify Audit Focus |
| INP | Responsiveness to every tap, click, and key press | 200 ms or less | Cart drawers, filters, variant pickers, product forms |
| LCP | Loading speed of the largest visible element | 2.5 seconds or less | Hero media, product images, theme render path |
| CLS | Visual stability as the page loads | 0.1 or less | Banners, fonts, app-injected blocks, lazy sections |
Google assesses all three Core Web Vitals at the 75th percentile of real user experiences, so at least 75% of visits must clear each threshold.
Why Should Shopify Teams Fix INP First?
Shopify storefronts depend on JavaScript for nearly every meaningful action a shopper takes. Apps add more scripts on top, often across templates you never open during a normal day. INP surfaces these costs first, because it measures the delay users feel after each tap.
How Main-Thread Blocking Affects Shopify Interactions
The main thread handles JavaScript, layout, and painting, so heavy work there freezes the interface. When an app script runs a long task, any tap during that task waits until the work finishes. Product pages feel this through variant pickers, subscription widgets, reviews, swatches, and add-to-cart logic.
Collection pages add filters, sorting, search, and infinite scroll, which all attach event handlers to the page. Cart drawers and mini-carts can rerender large sections every time a shopper opens them. Tracking tags, chat widgets, loyalty apps, and review widgets each compete for the same main thread.
Why Good Lighthouse Scores Can Hide INP Problems
A clean Lighthouse audit reflects one simulated load, not the messy reality of real taps. INP problems often slip past a healthy lab score because interactions happen after the page settles. Real user data from CrUX and Shopify reports exposes the slow moments that a single lab run misses.
How Do Teams Measure INP with Field and Lab Data?
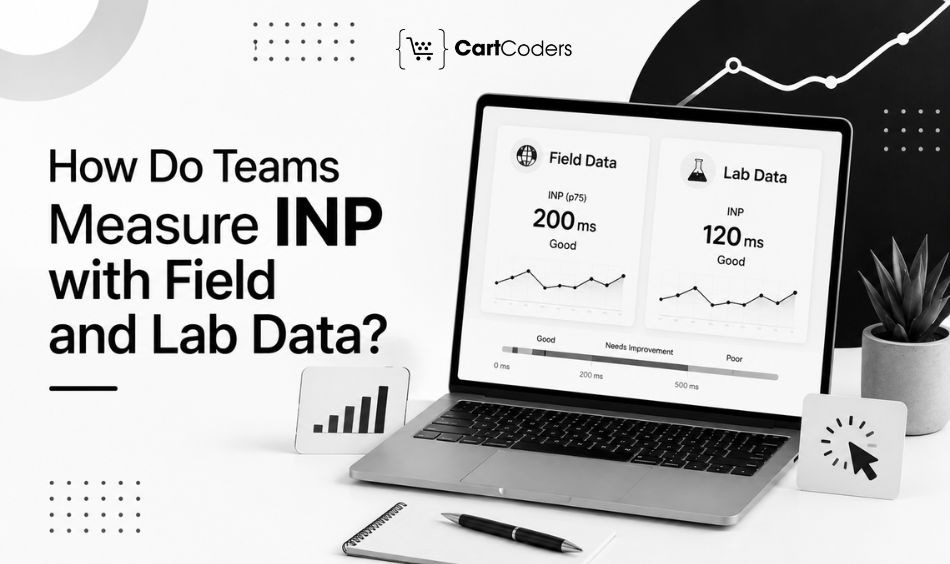
Accurate measurement pairs field data from real users with lab tools that reproduce the problem. Field data sets your priorities, while lab tools help you find the exact cause. A Shopify performance audit works best when both sources agree on the same slow template.
The workflow below moves from broad field signals down to a specific script in a trace. Each step produces an output you carry into the next, which keeps the audit repeatable.
| Audit Step | Tool or Data Source | What to Check | Output |
| Search Console review | Google Search Console | Which URL groups fail INP, LCP, CLS | Failing template list |
| Web Performance report | Shopify admin reports | Metric ranking and event annotations | Store-level baseline |
| Field data check | PageSpeed Insights | Field INP for key URLs | Page-level priority |
| CrUX template grouping | CrUX data | Real user INP by template pattern | Grouped problem map |
| Lighthouse lab run | Lighthouse audit | Diagnostics and total blocking time | Candidate causes |
| DevTools recording | Chrome DevTools Performance panel | Long tasks during interactions | Root-cause traces |
| Long-task review | Chrome DevTools | Tasks over 50 ms on the main thread | Scripts to split |
| JavaScript coverage | Chrome DevTools coverage | Unused JavaScript per template | Removal targets |
| App and script inventory | Theme and app list | Scripts injected per template | Triage list |
| Template issue mapping | Audit notes | INP cause per template | Fix backlog |
| Fix priority scoring | Risk and effort matrix | Impact against effort | Ranked plan |
| Post-fix validation | Field and lab tools | INP change after each fix | Verified result |
Field Data vs Lab Data
Field data reflects real devices, networks, and interaction patterns across a rolling window. Lab data gives you a controlled setting to test one interaction at a time. Use field data to decide where to look, then switch to lab tools to confirm the cause.
| Data Type | Best Tool | What It Shows | Limitation |
| CrUX field data | PageSpeed Insights or CrUX API | Real user Core Web Vitals over 28 days | No per-interaction detail |
| Search Console CWV | Google Search Console | Failing URL groups sitewide | Slow to reflect changes |
| Shopify reports | Shopify admin | Store metrics with event annotations | Storefront pages only |
| PageSpeed Insights | PageSpeed Insights | Field and lab data per URL | Single simulated lab load |
| Lighthouse | Lighthouse audit | Lab diagnostics and blocking time | Cannot fully measure INP |
| Chrome DevTools | Performance panel | Main-thread work per interaction | One session at a time |
| RUM tracking | web-vitals script or RUM tool | Real INP with element attribution | Needs setup and upkeep |
Field data should guide priority, while lab tools help diagnose the cause behind each slow interaction.
Which Shopify Templates Usually Cause Poor INP?
Template-level auditing keeps the work focused on the pages that drive revenue. Each Shopify template carries its own interaction risks, from homepage sliders to product forms. You test the real actions shoppers take, then record where the next paint lags.
Shopify checkout pages run on Shopify infrastructure, so non-Plus stores have limited control there. Focus your audit on controllable storefront pages and checkout-adjacent interactions instead.
| Template | Common INP Risk | What to Test |
| Homepage | Sliders, popups, and hero scripts on load | Menu taps, slider controls, promo popups |
| Collection page | Filters, sorting, and infinite scroll handlers | Filter clicks, sort changes, load-more taps |
| Product page | Variant pickers, swatches, and add-to-cart logic | Variant selection, quantity change, add-to-cart |
| Cart drawer | Rerenders and app widgets on open | Drawer open, quantity edit, remove item |
| Cart page | Discount fields and shipping estimators | Code apply, quantity update, checkout tap |
| Search page | Predictive search and result rerenders | Query typing, suggestion taps, result filters |
| Account page | Form validation and order history scripts | Login submit, form edits, tab switches |
| Blog or content page | Related-content and share widgets | Link taps, share buttons, comment forms |
| Landing page | Marketing scripts and embedded media | CTA taps, form fields, video controls |
| Checkout-adjacent flow | App scripts near cart and checkout | Express checkout taps, upsell actions |
What Causes Poor INP on Shopify Stores?
Most INP problems trace back to JavaScript that runs too long at the wrong moment. Apps, theme code, and third-party tags each contribute their share of main-thread work. The table maps common causes to Shopify examples and a safe fix direction.
| Cause | Shopify Example | Fix Direction |
| Long JavaScript tasks | A single app script runs for hundreds of ms | Split work and yield to the main thread |
| Too many app scripts | Ten apps each load code on every page | Reduce, scope, or replace apps |
| Global app injection | An app adds scripts to templates it never uses | Limit the script to needed templates |
| Heavy variant selector logic | Swatch changes recalculate the whole page | Simplify the handler and cache data |
| Slow add-to-cart handling | The button waits on several scripts | Trim work and give instant feedback |
| Cart drawer rerendering | Opening the drawer rebuilds large sections | Rerender only the changed elements |
| Collection filters | Each filter click reflows the full grid | Debounce input and update in place |
| Third-party tracking tags | Pixels fire heavy code during interactions | Load through a tag manager and defer |
| Chat widgets | A support widget blocks early taps | Delay load until idle or interaction |
| Review widgets | A review app runs on every product view | Lazy-load below the fold |
| Subscription widgets | Subscription logic runs on page load | Load on demand near the action |
| Unused theme JavaScript | Old features still ship their scripts | Remove dead code from templates |
| Synchronous scripts | A blocking script pauses the main thread | Use async or defer where safe |
| Expensive DOM updates | A handler rewrites many nodes at once | Batch updates and reduce nodes |
| Delayed rendering | The next paint waits on extra work | Prioritize the visible response first |
How to Triage Apps and Third-Party Scripts
App bloat builds quietly as teams add features over months of growth. Every app that injects a storefront script adds weight to interactions across your store. A careful triage separates revenue-critical tools from scripts you can safely defer or remove. You work through the list below with a duplicate theme and clear before-and-after tests.
- List every installed app, including disabled and staff-installed tools.
- Check which apps inject storefront scripts and on which templates.
- Identify scripts that load on every page instead of only where needed.
- Remove unused app embeds and leftover code from uninstalled apps.
- Limit each script to the templates that need it.
- Review tracking tags for duplicate firing and unnecessary pixels.
- Defer or delay non-critical scripts where testing confirms it is safe.
- Test cart and product interactions after every script change.
- Check for app conflicts that break interactions or analytics.
- Document every removed or delayed script for future reference.
Script triage works by scoping and lightening apps, not by clearing the store. Some apps drive real revenue, so you keep them and reduce their impact instead. Custom Shopify app development can replace a heavy third-party tool with a lighter build when the numbers justify it. Document each change so your team can trace any regression back to its source.
How to Diagnose INP in Chrome DevTools
The Chrome DevTools Performance panel records exactly what the main thread does during an interaction. You capture a real tap, then read the flame chart for long tasks and layout work. This step turns a vague complaint about slowness into a specific script and function. Mobile throttling makes the numbers match what shoppers on mid-range phones feel.
- Record a product page interaction such as selecting a variant.
- Record a collection filter interaction and note the delay.
- Record a cart drawer open and close on a real product.
- Identify long tasks over 50 ms in the flame chart.
- Inspect main-thread blocking during each captured interaction.
- Review event handlers attached to buttons, filters, and forms.
- Check rendering and layout work triggered after the tap.
- Compare traces before and after each app or script change.
- Test with mobile CPU throttling to match mid-range devices.
- Save screenshots and trace notes for the audit report.
Each recording becomes evidence in your audit report, not just a passing observation. Long tasks over 50 milliseconds usually point to the handler worth splitting first. Save your screenshots and notes so the team can compare states before and after a change. Repeat the same steps after every fix to confirm the interaction improved.
How Should Developers Prioritize Fixes Across INP, LCP, and CLS?
A fix plan works only when it ranks issues by user impact against the effort to solve them. High-impact, low-effort fixes ship first, while risky changes wait for proper testing. The matrix gives your team a shared language for triage across INP, LCP, and CLS.
| Issue Type | User Impact | Fix Effort | Priority |
| App script loaded sitewide | High | Medium | High |
| Product form delay | High | Medium | High |
| Cart drawer delay | High | Medium | High |
| Collection filter delay | High | Medium | High |
| Heavy hero media affecting LCP | High | Low | High |
| Layout shift from banners | Medium | Low | Medium |
| Unused third-party tags | Medium | Low | Medium |
| Tracking script conflict | Medium | Medium | Medium |
| Review widget delay | Medium | Low | Medium |
| Custom theme JavaScript issue | Medium | High | Medium |
| Shopify Plus checkout-adjacent issue | High | High | Medium |
Get a technical audit that reviews scripts, apps, theme code, and Core Web Vitals priorities.
A focused review pairs your real user data with a template-level plan you can act on. See where responsiveness slips, then get a prioritized fix list within days.


How to Fix INP Without Breaking the Store
Safe performance work protects revenue while you reduce main-thread load. You test changes in a duplicate theme before anything reaches live traffic. Careful sequencing keeps analytics, checkout, and cart flows intact through every edit.
Keep revenue-critical apps in place until the owner approves any change to them. Delay non-critical scripts carefully, and split long JavaScript work into smaller tasks where possible. Reduce sitewide script loading so each page only runs what it needs.
Simplify cart drawer rerenders, and move low-priority widgets like reviews below the fold. Validate analytics after every script change, then run QA on product, cart, and checkout-adjacent flows. Larger cleanups sometimes need a proper Shopify custom theme development effort rather than small patches. When effort grows, dedicated Shopify Plus development support keeps checkout-adjacent work stable under load.
What Should a Technical Audit Report Include?
A strong audit report gives your team a plan, not just a pile of scores. Each finding ties a metric to a template, a cause, and a recommended fix. The deliverables below make the audit useful for both developers and operations leads.
| Deliverable | What It Includes | Why It Helps |
| Core Web Vitals baseline | Field metrics for INP, LCP, CLS by template | Sets a clear starting point |
| INP issue map | Slow interactions grouped by template | Shows where to focus first |
| Template-level findings | Cause notes per homepage, product, collection | Keeps fixes targeted |
| App and script inventory | Scripts injected per app and template | Reveals hidden main-thread load |
| Long-task notes | Traces of tasks over 50 ms | Points to the handlers to split |
| Priority fix list | Ranked issues by impact and effort | Guides the fix sequence |
| Risk and effort score | A score for each recommended fix | Balances value against work |
| Implementation plan | Steps and owners for each fix | Moves the team from report to action |
| QA checklist | Tests for product, cart, and checkout flows | Protects revenue during changes |
| Validation plan | Before-and-after measurement steps | Confirms each fix worked |
| Post-fix monitoring notes | Metrics to watch after launch | Catches regressions early |
How Much Does a Shopify Core Web Vitals Audit Cost?
Pricing depends on scope, so treat the ranges below as planning figures rather than fixed quotes. A basic Shopify technical audit usually runs from $500 to $2,500 or more. A dedicated audit for small to mid-size Shopify stores tends to land between $1,500 and $5,000 or more.
Shopify Plus or complex storefront audits often range from $5,000 to $15,000 or more. INP-focused JavaScript and app bloat cleanup runs from $1,000 to $8,000 or more, depending on the app stack. A theme refactor or performance sprint can reach $5,000 to $25,000 or more as complexity grows.
Ongoing performance monitoring and technical support usually costs $1,000 to $7,500 or more per month. Final pricing depends on catalog size, traffic, theme complexity, app stack, third-party scripts, Shopify Plus needs, checkout customizations, tracking setup, QA depth, and fix implementation scope. Share your store details to get a figure matched to your actual work.
Work With CartCoders on Your Shopify Core Web Vitals Audit
CartCoders helps Shopify teams audit INP, Core Web Vitals, theme code, app bloat, and third-party scripts together. The same review covers checkout-adjacent flows, tracking issues, and the technical performance risks that hurt responsiveness. Developer-led findings give your team a prioritized plan instead of a generic speed checklist.
Every audit connects field data to template-level fixes your developers can implement the same week. Request a Free Technical Audit to see where your store loses responsiveness and how to recover it.
Conclusion
INP gives your team the fastest signal about how a Shopify store feels under real use. Start your Shopify Core Web Vitals audit with field data, group slow interactions by template, and then fix the highest-impact issues first. Loading and layout work follows naturally once responsiveness has a clear owner and a measurable target. Your next step is simple: pull your real user metrics, record one slow interaction, and score the fix. When you want a developer-led review with a prioritized plan, request a Free Technical Audit and move from findings to shipped fixes.
Frequently Asked Questions
This audit reviews how real shoppers experience loading, interactivity, and visual stability on your store. It checks INP, LCP, and CLS with field and lab data, maps issues to templates, and delivers a prioritized fix plan for developers.
INP measures every interaction, so it exposes the delays shoppers feel when they tap add-to-cart, open a drawer, or use filters. Shopify stores run heavy JavaScript through apps and theme code, which makes responsiveness the most common hidden problem to catch early.
Long JavaScript tasks are the main cause, because they block the main thread during interactions. Common sources include app scripts injected sitewide, heavy variant selectors, cart drawer rerenders, collection filters, tracking tags, and review or chat widgets that delay the next paint.
Start with field data from Google Search Console, Shopify Web Performance reports, and PageSpeed Insights. Then record real interactions in the Chrome DevTools Performance panel to find long tasks. Field data sets priorities, and lab tools confirm the cause behind each slow page.
Most audits range from about $1,500 to $5,000 for small to mid-size stores, while Shopify Plus or complex storefronts run $5,000 to $15,000 or more. Final pricing depends on catalog size, app stack, traffic, and how many fixes you want implemented.
Request a Free Technical Audit before a redesign, migration, or performance sprint, or right after INP drops in your reports. An audit also helps when app installs, theme updates, or new tracking scripts change how your store responds to shoppers.


